Contact Us

Leica Microsystems

Leica Microsystems

Leica Microsystems is a world leader in microscopes and scientific instruments. Founded as a family business in the nineteenth century, the company’s history was marked by unparalleled innovation on its way to becoming a global enterprise.

Its historically close cooperation with the scientific community is the key to Leica Microsystems’ tradition of innovation, which draws on users’ ideas and creates solutions tailored to their requirements. At the global level, Leica Microsystems is organized in three divisions, all of which are among the leaders in their respective fields: Life Science, Industry and Medical.

The company is represented in over 100 countries with 6 manufacturing facilities in 5 countries, sales and service organizations in 20 countries, and an international network of dealers. The company is headquartered in Wetzlar, Germany.
http://www.leica-microsystems.com/

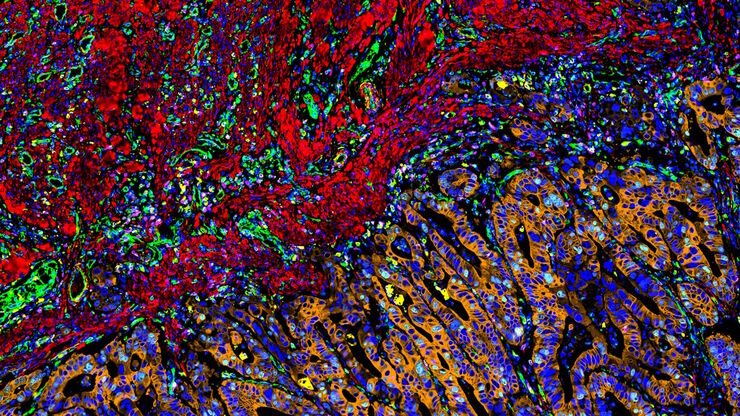
Multiplexed Cell DIVE imaging of Colon Adenocarcinoma (CAC) tissue. A panel of approximately 30 biomarkers targeted towards various leukocyte lineages, epithelial, stromal, and endothelial cell types was utilized to characterize the tumor immune microenvironment in human colon adenocarcinoma (CAC) tissue.

Mapping the Landscape of Colorectal Adenocarcinoma with Imaging and AI

Discover deep insights in colon adenocarcinoma and other immuno-oncology realms through the potent combination of multiplexed imaging of Cell DIVE and Aivia AI-based image analysis
Clustering based analysis reveals various immune cell populations enriched in tumor cells within CT26.WT syngeneic mouse tumor models.

Spatial Architecture of Tumor and Immune Cells in Tumor Tissues

Dig deep into the spatial biology of cancer progression and mouse immune-oncology in this poster, and learn how tumor metabolism can effect immune cell function.
Pancreatic Ductal Adenocarcinoma with 11 Aerobic Glycolysis/Warburg Effect biomarkers shown – BCAT, Glut1, HK2, HTR2B, LDHA, NaKATPase, PCAD, PCK26, PKM2, SMA1, and Vimentin.

IBEX, Cell DIVE, and RNA-Seq: A Multi-omics Approach to Follicular Lymphoma

In a recent study by Radtke et al., a multi-omics spatial biology approach helps shed light on early relapsing lymphoma patients
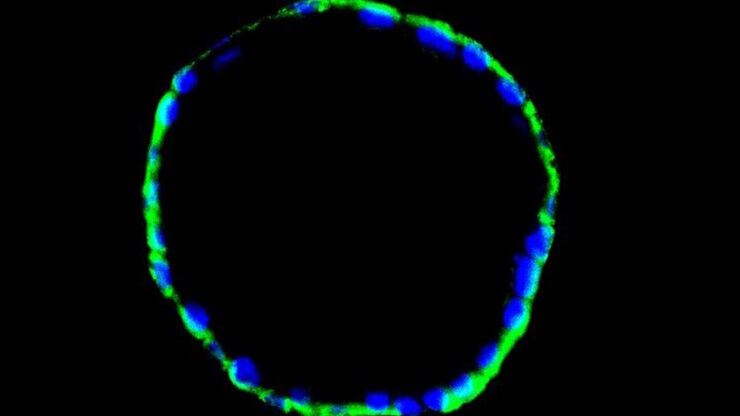
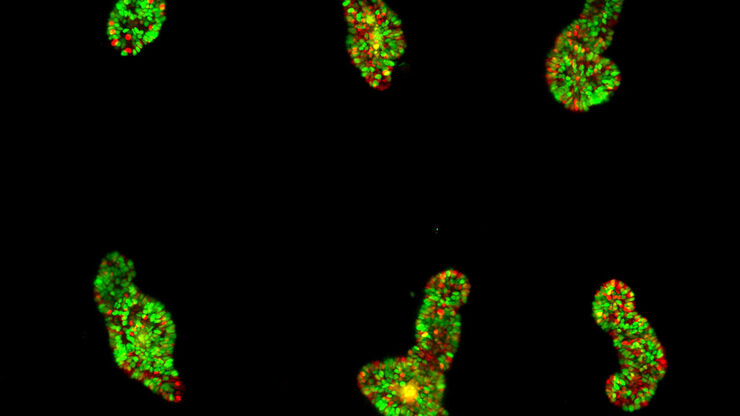
40x magnification of organoids cluster taken on Mateo TL.Cell type: esophageal squamous carcinoma; scale  bar 15µm. Courtesy of bioGenous, China.

Overcoming Observational Challenges in Organoid 3D Cell Culture

Learn how to overcome challenges in observing organoid growth. Read this article and discover new solutions for real-time monitoring which do not disturb the 3D structure of the organoids over time.
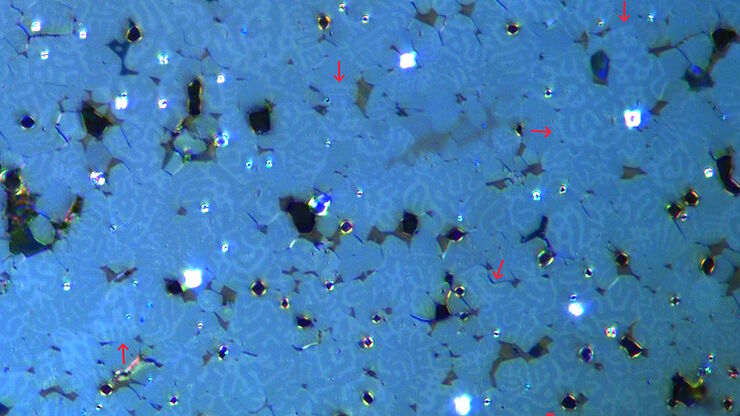
Image of burrs (red arrows) at the edge of a battery electrode acquired with a DVM6 digital microscope.

Burr Detection During Battery Manufacturing

See how optical microscopy can be used for burr detection on battery electrodes and determination of damage potential to achieve rapid and reliable quality control during battery manufacturing.
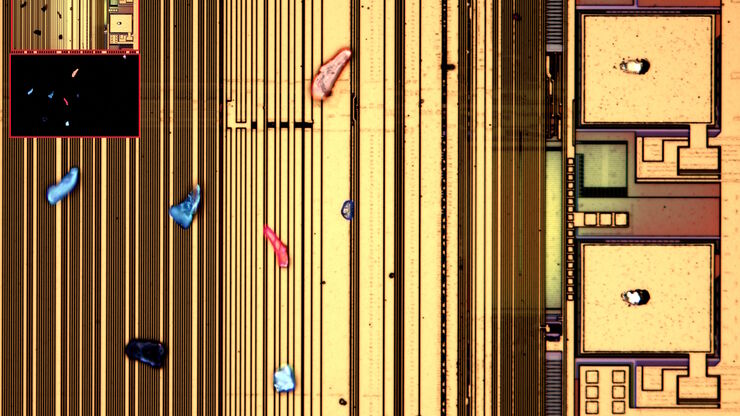
Particles observed on the surface of a particle trap which could be used for technical cleanliness during battery production.

Battery Particle Detection During the Production Process

How battery particle detection and analysis is enhanced with optical microscopy and laser spectroscopy for rapid, reliable, and cost-effective QC during battery production is explained in this…
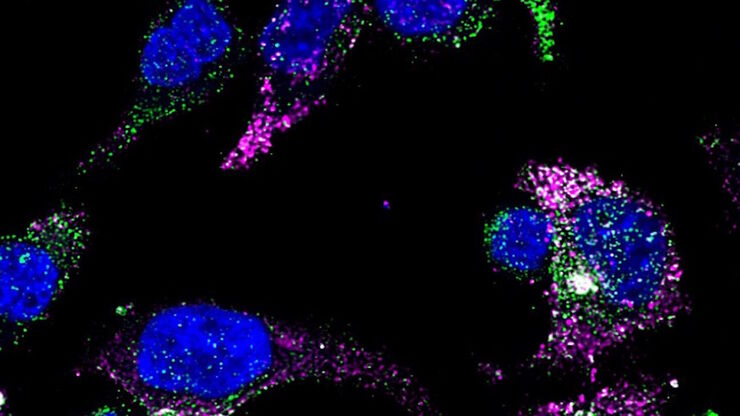
THUNDER image of brain-capillary endothelial-like cells derived from human iPSCs (induced pluripotent stem cells) where cyan indicates nuclei and magenta tight junctions.

Rapid Check of Live Stem Cells in Cell-Culture Inserts set in Multi-Well Plates

See how efficient imaging of live iPSC stem cells within cell-culture inserts set in a multi-well plate can be done to evaluate the cells using a THUNDER Imager. Just read this article.
Camera image during auto alignment. The feedback lines indicate if the correct edges in the image are detected. Green: Vertical center line; Magenta: Upper edge of the light gap; White: Lower edge of the light gap (not visible here, falling together with red line); Red: Knife edge; Blue: Left and right edge of the block face being automatically detected.

Automatic Alignment of Sample and Knife for High Sectioning Quality

Automatic alignment of sample and knife on the ultramicrotome UC Enuity, enabling even untrained users to create ultrathin sections with reduced risk of losing precious sections.
Section ribbons with increasing section thickness - silver to purple ending in blue sections.

High Quality Sectioning in Ultramicrotomy

Discover the significance of achieving high-quality uniform sections with ultramicrotomy for precise imaging in electron microscopy.
Multicolor fixed STED image. Inner ear section, mouse, TauSTED Xtend 589 on AF488 and TauSTED Xtend 775 on AF633-Phalloidin. Sample courtesy of Dennis Derstrof, Klinik für Hals-, Nasen und Ohrenheilkunde, Universität Marburg & Prof. Dr. Dominik Oliver aus dem Institut für Physiologie und Pathophysiologie, Abteilung für Neurophysiologie, Universität Marburg.

Extended Live-cell Imaging at Nanoscale Resolution

Extended live-cell imaging with TauSTED Xtend. Combined spatial and lifetime information allow super-resolution microscopy at extremely low light dose.
Multicolor TauSTED Xtend 775 for Cell Biology applications that require nanoscopy resolution for multiple cellular components. Cells showing vimentin fibrils (AF 594), actin network (ATTO 647N), and nuclear pore basket (CF 680R). Sample courtesy of Brigitte Bergner, Mariano Gonzales Pisfil, Steffen Dietzel, Core Facility Bioimaging, Biomedical Center, Ludwig-Maximilians-University, Munich, Germany.

The Guide to STED Sample Preparation

This guide is intended to help users optimize sample preparation for stimulated emission depletion (STED) nanoscopy, specifically when using the STED microscope from Leica Microsystems. It gives an…
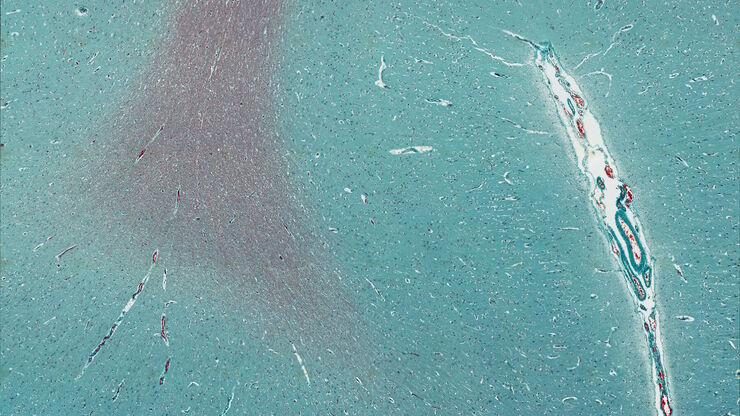
Masson-Goldner staining of a hedgehog brain slice.

How to Streamline Your Histology Workflows

Streamline your histology workflows. The unique Fluosync detection method embedded into Mica enables high-res RGB color imaging in one shot.
An 8-color spectral unmixing result from a hyperspectral SRS (stimulated Raman scattering) dataset, showing the biochemically distinct structures of a fresh, untreated apple slice.

How to Prepare Samples for Stimulated Raman Scattering (SRS) imaging

Find here guidelines for how to prepare samples for stimulated Raman scattering (SRS), acquire images, analyze data, and develop suitable workflows. SRS spectroscopic imaging is also known as SRS…

RPE65 Gene Therapy Subretinal Injection: Benefits of Intraoperative OCT

Discover how RPE65 gene therapy subretinal injection procedures in patients with Leber congenital amaurosis is supported by intraoperative Optical Coherence Tomography.

Accelerating Discovery for Multiplexed Imaging of Diverse Tissues

Explore IBEX: Open-source multiplexed imaging. Join the collaborative IBEX Imaging Community for optimized tissue processing, antibody selection, and human atlas construction.
Particulate contamination in between moving metal plates.

Key Factors for Efficient Cleanliness Analysis

An overview of the key factors necessary for technical cleanliness and efficient cleanliness analysis concerning automotive and electronics manufacturing and production is provided in this article.
Microscope equipped with a K7 color CMOS camera for life-science and industry imaging applications.

Technical Terms for Digital Microscope Cameras and Image Analysis

Learn more about the basic principles behind digital microscope camera technologies, how digital cameras work, and take advantage of a reference list of technical terms from this article.
Images of the same area of a processed wafer taken with standard (left) and oblique (right) brightfield illumination using a Leica compound microscope. The defect on the wafer surface is clearly more visible with oblique illumination.

Rapid Semiconductor Inspection with Microscope Contrast Methods

Semiconductor inspection during the production of patterned wafers and ICs (integrated circuits) is important for identifying and minimizing defects. To increase the efficiency of quality control in…
2D slice of colon cancer tissue stained with 30 markers and imaged using the Cell DIVE system. Analysis performed using Aivia 13’s new multiplex cell detection recipe and automatic clustering tool. Each phenotype denoted in a different color.

Transforming Multiplexed 2D Data into Spatial Insights Guided by AI

Aivia 13 handles large 2D images and enables researchers to obtain deep insights into microenvironment surrounding their phenotypes with millions of detected objects and automatic clustering up to 30…
Spheroid stained with Cyan: Dapi nuclear countertain; Green AF488 Involucrin; Orange AF55 Phalloidin Actin; Magenta AF647 CK14.

Notable AI-based Solutions for Phenotypic Drug Screening

Learn about notable optical microscope solutions for phenotypic drug screening using 3D-cell culture, both planning and execution, from this free, on-demand webinar.
Hepatocellular Carcinoma with 13 biomarkers shown – Beta-Catenin, CD3D, CD4, CD8a, CD31, CD44, CD163, DAPI, PanCK, PCK26, PD1, SMA, and Vimentin.

Understanding Tumor Heterogeneity with Protein Marker Imaging

Explore tumor heterogeneity and immune cell dynamics. See how quantitative imaging analysis reveals spatial relationships and molecular insights crucial for advancing cancer research and therapeutics.
Adult human Alzheimer’s brain demonstrating a panel of 15 markers.

The Shape of the Brain: Spatial Biology of Alzheimer’s Disease

Uncover cell identity and brain structure in Alzheimer's disease with Cell DIVE multiplexed imaging, demonstrating how spatial biology can lead to advances in therapy development for…
Preparation of an IC-chip cross section: grinding and polishing of the chip cross section.

Cross-section Analysis for Electronics Manufacturing

This article describes cross-section analysis for electronics concerning quality control and failure analysis of printed circuit boards (PCBs) and assemblies (PCBAs), integrated circuits (ICs), etc.
Murine esophageal organoids (DAPI, Integrin26-AF 488, SOX2-AF568) imaged with the THUNDER Imager 3D Cell Culture. Courtesy of Dr. F.T. Arroso Martins, Tamere University, Finland.

How to Get Deeper Insights into your Organoid and Spheroid Models

In this eBook, learn about key considerations for imaging 3D cultures, such as organoids and spheroids, and discover microscopy solutions to shed new insights into dynamic processes in 3D real-time
Water Flea Daphnia imaged by Electron Microscopy. Courtesy of Mag. Dr. Gruber, University of Vienna, Austria

Streamline your EM Sample Preparation Workflow for Biological Applications

Master EM sample preparation, including ultramicrotomy, for life sciences in this expert eBook!
Image of immunofluorescently labelled cells where mitochondria are indicated with red, nuclei with blue, and actin with green.

Studying Virus Replication with Fluorescence Microscopy

The results from research on SARS-CoV-2 virus replication kinetics, adaption capabilities, and cytopathology in Vero E6 cells, done with the help of fluorescence microscopy, are described in this…
Co-detection of 10 extracellular matrix proteins and 3 topographical tissue landmarks by multiplex immunostaining within a single high-grade fibrous hotspot from a human hepatocellular carcinoma

In Situ Identification of Cancer Stem Cell Niches in Hepatocellular Carcinoma

Discover how multiplexed imaging technology uncovers cancer stem cell niches in Hepatocellular Carcinoma using multiplex immunodetection, revealing extracellular matrix dynamics. Explore precise…
Image of a Siemens star, where the diameter of the 1st black line circle is 10 mm and the 2nd is 20 mm, taken via an eyepiece of a M205 A stereo microscope. The rectangles represent the field of view (FOV) of a Leica digital camera when installed with various C-mounts (red 0.32x, blue 0.5x, green 0.63x).

Understanding Clearly the Magnification of Microscopy

To help users better understand the magnification of microscopy and how to determine the useful range of magnification values for digital microscopes, this article provides helpful guidelines.
Fluorescence microscopy image of liver tissue where DNA in the nuclei are stained with Feulgen-pararosanilin and visualized with transmitted green light.

Epi-Illumination Fluorescence and Reflection-Contrast Microscopy

This article discusses the development of epi-illumination and reflection contrast for fluorescence microscopy concerning life-science applications. Much was done by the Ploem research group…
Esophageal tissue with a squamous cell carcinoma labelled with the 4 biomarkers PanCk, DAPI, NaKATPase, and Vimentin.

Discover how Multiplexed Bioimaging can Advance Cancer Research

Explore multiplexing with up to 60 biomarkers, enabling advanced tumor imaging approaches to gather precise, spatially-resolved single-cell data that helps enhance cancer research and clinical…
Scroll to top