 tissue.")
Accurately detect cells in multiplexed images using AI
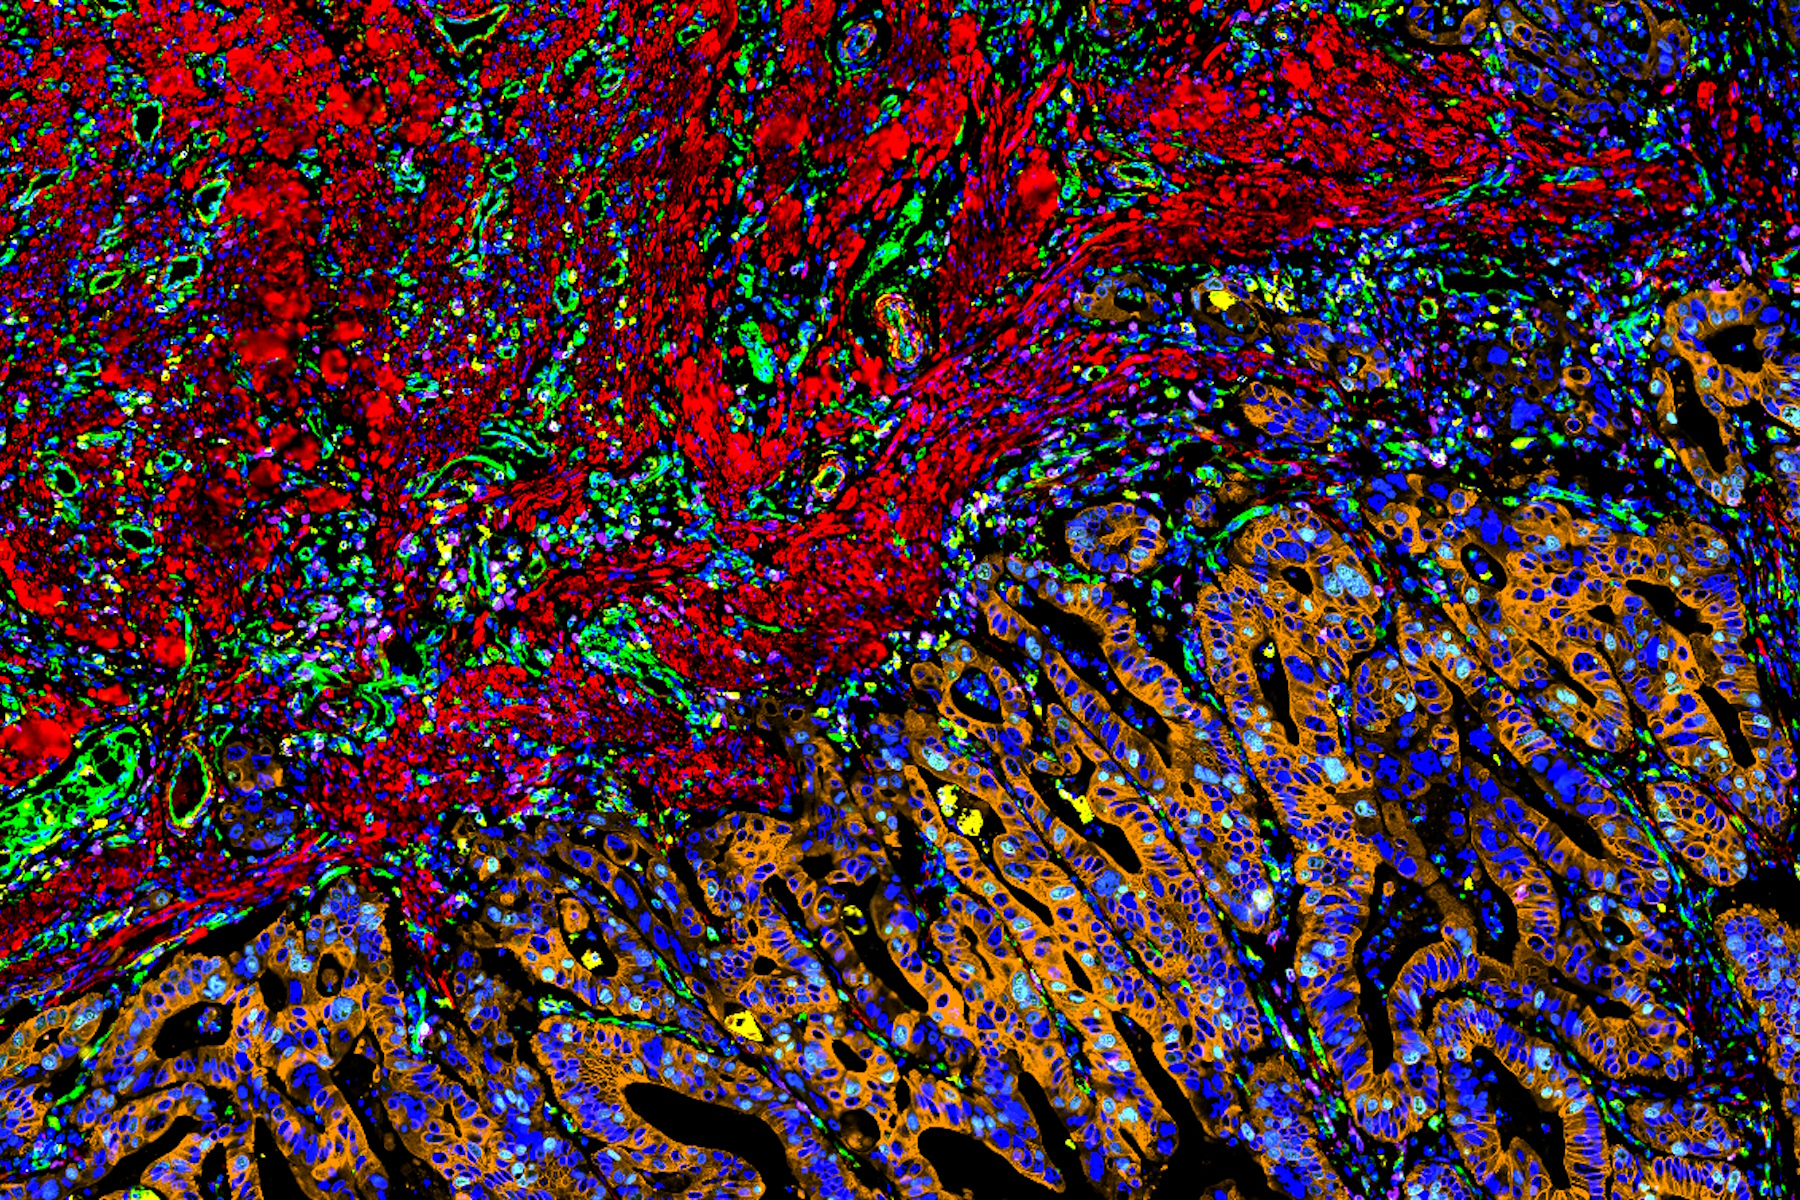
To draw quantitative, biological insights the first step is often detecting and segmenting the individual cells within the entire image. Aivia’s Multiplexed Cell Detection recipe leverages a modified Cellpose [1] algorithm to accurately detect cell nucleus and membrane with different morphologies. In this CAC example, the DAPI and NaKATPase channels were used as a nucleus and membrane marker respectively to segment all the cells in this tissue. Within the CAC tissue, a total of 555,480 cells were identified and segmented, with an average cytoplasmic area of 66.51 µm2, average nuclear area of 38 µm2, and nuclear circularity of 0.77.

Automatic clustering to reveal unknown phenotypes
Unknown cell phenotypes can also be identified in an unsupervised way using the automatic clustering tool in Aivia. Instead of defining a priori biomarker profile for each phenotype, the PhenoGraph-Leiden [2] clustering tool can create groups of phenotypes based solely on biomarker expression similarity across the entire panel. These phenotypic clusters can then be organized based on their similarity to the other clusters discovered in the analysis via heat map and dendrogram. Utilizing the dendrogram feature we can visually examine some important trends and enriched cell populations within the typically heterogenous CAC dataset. Additionally, cell phenotypes that are relatively less abundant in the tissue may be captured with ease with such analyses.
Conclusion
The complexity of spatial biology datasets brings unique challenges to data collection, annotation, and analysis. The process detailed here: segmentation, phenotyping, and clustering of phenotypes is one pathway into extracting useful information from large 2D datasets such as Cell DIVE images. By following this general pathway, researchers can extract cell identity, cell position, morphological data, and more while applying that information directly to their tissue of interest. Beyond raw analysis, clustering and dimensionality reduction-based approaches allow for both a high-level overview of the data and the possibility of hypothesis generation based on unforeseen relationships in phenotypic clusters.