Introduction
The mammalian Target of Rapamycin (mTOR) pathway co-ordinates the availability of nutrients, growth factors, and the energy status of the cell with the activation of its downstream target proteins via phosphorylation events [2]. In this cascade signaling pathway, these downstream substrates are responsible for regulating functions, such as cell proliferation, protein synthesis, autophagy, senescence, and apoptosis. The mTOR protein exists in two complexes (Figure 1): Complex 1 (mTORC1) and Complex 2 (mTORC2). The broad functionality of the mTOR protein makes it an attractive drug target in diseases closely associated with dysfunctional or hyper-activated mTOR signaling like cancer.
First generation mTOR inhibitors, such as rapamycin and clinically approved analogues (rapalogs), even though they initially showed effectiveness in previous preclinical models, turned out to only partially inhibit mTOR by targeting Complex 1. Recent studies have also shown that tumors develop rapalog resistance to first generation mTOR inhibitors and exhibit effectiveness in few types of cancer. As mTORC2 directly phosphorylates Akt, an important protein involved in cell survival, there is a likely need to inhibit both complexes for effective cancer treatments.
Novel second-generation ATP-competitive inhibitors, such as AZD2014, provide improved antitumor activity by targeting both mTORC1 and mTORC2 [3]. Although AZD2014 is currently undergoing active clinical trials, its mode of action is unknown. To investigate the working mechanism of AZD2014, Digital LightSheet (DLS) Microscopy was used to observe the cellular uptake of AZD2014 within a living 3D-cell-culture-model environment, taking advantage of its naturally occurring fluorescence properties and its localization within living spheroids [4].

Materials and methods
To investigate AZD2014 within the spheroid environment, HEK293 cells were cultured in 96-well round -bottom plates (U-well) at a cell density of 10,000 cells per well. After growing the cells for 72 hours at 37˚C and 5% CO2, the HEK293 cells self-assemble into spheroids. The spheroids are then transferred to low-melting-point-agarose holders sitting in 35-mm glass-bottom dishes, each dish containing wells capable of holding up to 5 spheroids. Wells had been casted into the agarose using a custom 3D-printed comb (Figure 2B). Once all 5 spheroids are loaded, the glass-bottom dish is filled with complete growth media and subsequently placed onto the microscope.
Following the addition of AZD2014 (final AZD2014 concentration of 7 μM), the samples were imaged at 37 ˚C and 5% CO2. A TCS SP8 DLS microscope was used to acquire 3D time-lapse images of the spheroids (Figure 2E). To monitor uptake of the drug into spheroids, for 2 hours 44 planes (dimensions of xyz stacks were 780 μm × 780 μm × 300 μm) were recorded every 15 seconds.
The volumes were acquired using a 10×/0.3 numerical aperture (NA) detection objective with a field of view of 735 μm × 735 μm. For generation of the digital light sheet, a 2.5×/0.07 NA objective was used together with a 405-nm laser, resulting in a sheet thickness of 3.7 μm and a Rayleigh length of 240 μm.
Two counter-propagating light sheets were used in order to reduce degradation of the image due to scattering of light caused by the thickness of the sample as well as to reduce striping effects. This is possible by taking advantage of Leica Microsystems’ unique design of the TwinFlect mirrors to generate the light sheet. Each frame was acquired with one light sheet at a time and merged into a single image.

Figure 2: Spheroids seeding, mounting, and imaging procedure. A) HEK293 cells were seeded into a 96-well round (U-well) bottom plate pre-cast with 100 µl of 1.5% agarose at a cell density of 10,000 cells per well with a final volume of 200 µl in complete growth media. B) 3D-printed comb used to create wells in agar to hold the spheroids during the imaging experiment. C) The spheroids were then transferred to the wells. The white circle shows a single spheroid in a well. D) Zoomed view of the circled spheroid in the panel. E) Principle of the Leica digital-light-sheet-fluorescence microscope with the light sheet created in between two mirrors where the spheroid is placed. F) The spheroid is moved through the light sheet and is optically sectioned. Figure taken from Ahmed et al. [1].
Results
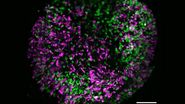
This study examined effects of AZD2014 in a tumor environment by first characterizing its uptake within a spheroid 3D cell culture model. After addition of AZD2014, a clear increase in AZD2014 intrinsic fluorescence could be observed. The outer layers of the spheroids showed a faster rate of uptake than the inner core of the spheroid (Figure 3). This became evident by looking at the different uptake rates at three selected depths relative to the spheroid surface [0 µm (surface), 100 μm (inner layer), and 200 μm (deeper layer)].
The corresponding rates are 80, 200, and 318 seconds after addition. Furthermore, a 25% (std = ±0.019%) increase in the average radius of the spheroids can be seen after 30 minutes exposure to AZD2014 (7μM). This increase in size occurred only when both the drug and 405-nm illumination were present on the samples. The latter finding suggests a unique, previously unknown, photoactivable property of this molecule.

Figure 3: Uptake of AZD2014 in 3D multi-layered spheroids. A) AZD2014 administration and imaging of HEK293 spheroid. Different xy planes or depths (rows) shown as well as an orthogonal projection (xz plane). B) Uptake rates of AZD2014 fluorescence in spheroid over a 2-hour time lapse was studied at different depths from the surface. C) Spheroid radius increase during imaging with AZD2014 administration. Image planes at 250 μm in depth shown at different time points from 30 min to 2 hours after administration. D) Mean rates of AZD2014 uptake at different depths. E) Graph showing relative increase in spheroid radius vs AZD2014 + 405-nm illumination, only 405-nm illumination, or only drug. Figure taken from Ahmed et al [1].
Discussion
Here we show that AZD2014 is taken up rapidly by living cells with a half-life of ~1 min in 3D spheroids studied using digital light sheet imaging. In addition, this approach brought into light a unique, previously unknown, photoactivable property of this molecule. The data presented in this publication suggests that AZD2014 may have the potential to act as a photoactivable drug that could be used in anti-cancer photodynamic therapies (PDT).
Conclusion
The ability to non-invasively monitor drug localization and behavior within living cancer cells in a 3D environment presents itself as a very powerful tool to gain a better understanding of tumor biology and improve cancer drug screening and development. Imaging with the TCS SP8 Digital LightSheet microscope in this study enabled the visualization of dynamic interactions of drug-administered cells within 3D tumor spheroid models by:
- giving the user unrestricted access to their samples due to its set-up, which allows easy and effective delivery of the drug or compound of interest during the workflow described here ;
- combining gentle and fast light sheet imaging with good subcellular resolution, allowing the study of dynamic processes like drug uptake or response in living samples;
- facilitating good penetration and image quality of 3D samples like spheroids due to dual-sided light sheet illumination and system-specific deconvolution algorithms;
- allowing imaging of multiple spheroids within one round of imaging and therewith provides a workflow that delivers more data for quantitative evaluation during a single experiment.


